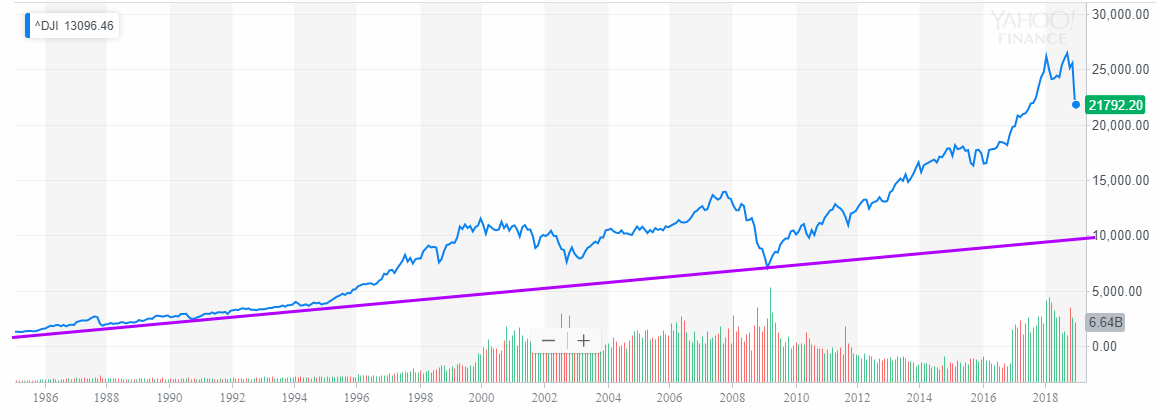
The monthly chart of the Dow going from 1985
Stock market bull vs bear: Each point on this chart represents a month’s worth of data; the worst one day crash (black Monday) is just an insignificant blip on this long-term chart, clearly proving that until Fiat money is eliminated that stock market crashes from a long-term perspective represent buying opportunities.
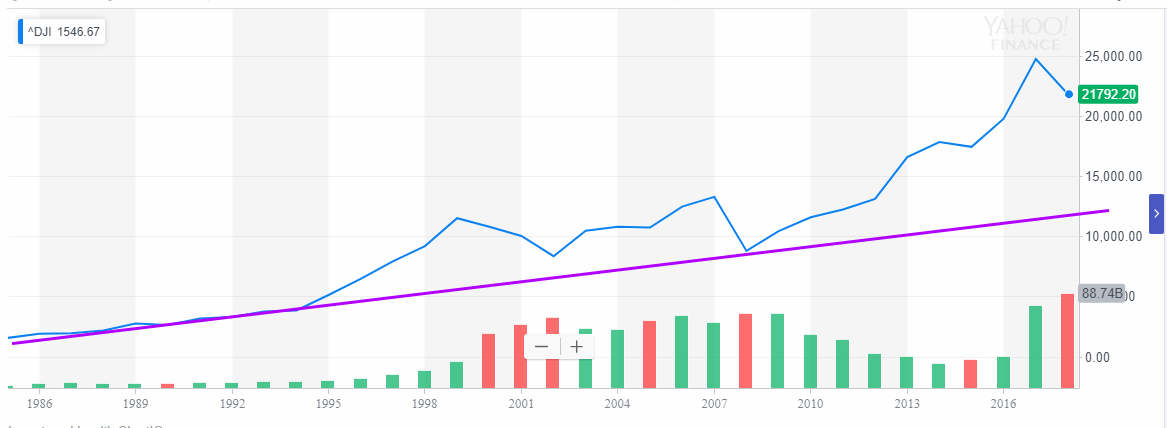
The yearly chart of the Dow from 1985
The same chart but now each point represents a year’s worth of data; one could argue that depending on the time frame one chooses, a back-breaking correction on the daily and weekly charts might appear as a small event on the monthly charts and almost a non-event on the yearly charts.
The stronger the deviation, the better the opportunity; markets always revert to the mean. No matter how much one might be tempted to disagree, the above charts state otherwise.
There are two main underlying themes behind every single market crash; a euphoric crowd and an extremely overbought market. Both elements were missing this time around, clearly highlighting that something else is at play here, and it smells dangerously akin to market manipulation. Market manipulation via weaponized news?
From a long-term perspective, this sharp pullback is creating another once in a lifetime buying opportunity event. The crash of 2008 was one of the most painful in recent history and yet despite this vicious pullback; the Dow is still trading well over 200% above its 2009 lows.
Another myth that is peddled over and over again is the issue of how long it takes a market to recoup it has lost gains. Our response is who cares? What matters is the stocks you are buying and not a particular market index. A vast number of stocks had already tacked on gains of several hundred percentage points before the Dow traded above its 2008 highs. The same is going to happen this time around. Strong companies will recoup their gains 2X to 3X faster than the broader markets, so when the Dow trades past 27K, some of these stocks will be showing gains in excess of 100%.
So what is going on now?
Why are the markets acting differently; one-word weaponized News. The action has been downright brutal, but something was off, the crowd was never euphoric, and the markets were not trading in the extremely overbought ranges.
The markets had already priced in Tariffs and a rate hike, but then things changed. Suddenly Trump had to emphasise that he is “tariff man”. Then he starts taking pot shots at the Fed. The Fed, in turn, takes shots at him, albeit indirectly, and the media goes ballistic. We are not taking sides here, what we are trying to portray is that old news was and is being turned into something sinister. Moreover, not a day goes by without some old nonsense being respun into a scarier version of the original story. When spin doctors are in charge of the media you need to take their sage advice with a shot of whiskey and a barrel of salt. In other words, when they scream you sing and vice versa. Mass psychology states that stock market crashes are buying opportunities; end of story.
Courtesy of Tactical Investor
Random Views on Long Term Trends in stock market 2019
Stock Market Tantrums Are Over, But For How Long?
Equities have been behaving like a recession is looming. That dire outlook seems overdone. While major global stock markets were battered in 2018 – and even the initially resilient U.S. Standard & Poor’s (S&P) 500 stumbled – we still expect equities to deliver solid returns in 2019. Assuming no price-to-earnings (P/E) expansion this year, and tagging on a 2% dividend, the S&P 500 could return 8%. Any modest P/E expansion could deliver 12% returns. Bank earnings this week, including JP Morgan and Wells Fargo, are likely to restore some faith in equity markets over the short-term.
However, trade tensions between the U.S. and China and fears over Federal Reserve System of the United States (Fed) tightening are definitely taking their toll on investor sentiment. Earlier in January, Apple posted a reduced revenue outlook, blaming Chinese demand, causing its stock price to tumble. Yale University’s Stephen Roach warned that it was “the canary in the coal mine.”
These fears could strangle growth, but fundamentally, the bleak backdrop for equities is starting to improve. Investors want evidence that the Fed is not on autopilot, and will continue to be hyper-sensitive to data disappointments until they get some positive U.S.-China trade news. A reduction in these risks could see an expansion in the P/E ratio – delivering a boost to equity markets. Full Story
Sven Henrich: My 2019 stock-market outlook
Cataclysmic action in the fourth quarter left investors shell-shocked, as U.S. stocks plummeted and over 90% of dollar-based asset classes fell for all of 2018.
Macro monsters from trade wars, Brexit, slowing economic growth, a slump in global property prices, political uncertainty, yield-curve inversions, deficit explosions, technical breakdowns, etc., are lurking everywhere, leaving investors blindfolded while they try to navigate highly volatile market waters in search for a safe destination in 2019.
As we learned in 2018, extremes can become more extreme, long-term trends matter, patterns matter, divergences matter, technical disconnects matter and now we’re dealing with the aftermath and their implications.
My main market message for 2019: Pay close attention and stay fully informed. There are a lot of complex moving technical and macro pieces driving markets and the global economy that make for a foggy outlook for the year ahead.
Wall Street tends to focus on a destination when it projects higher year-end target prices. Indeed, as in 2018 and in 2008, Wall Street is again projecting higher prices for this year. While higher prices are always a possibility, my focus in this report is on the journey rather than the destination, as I expect wild price swings within the 2018 range (2,340-2,941 points in the S&P 500 Index SPX, +0.12% ) and possibly a much lower range still to come. Full Story
Stock Market Forecast For 2019: 7 Critical Trends To Watch
The new year begins with a gnawing question: Is the stock market correction of the past three months a harbinger of an awful 2019, or a launchpad for a new bull market? While it’s folly to make a decisive stock market forecast for 2019, a few trends hold clues.
On the face of it, financial markets seem to sense trouble. On Christmas Eve, the S&P 500 index hit the 20% threshold for a bear market.
Few experts see a recession, but signs of slowing economic growth are piling up. The 10-year Treasury yield has fallen to the lowest since April, even as the Fed tightens and unwinds its quantitative easing program.
Of all these factors, two stand out because of their unpredictability and consequences: trade policy and interest rates. The trade war can expand suddenly into multiple industries and cause spillover effects. Markets fear Fed rate hikes will overshoot, sending the economy into recession.Here’s a look at each of the seven factors, plus tips on how stock market investors can prepare for whatever 2019 brings.
1. Stock Market Volatility
For much of 2018, the stock market tolerated a trade war, Treasury yield anxiety, Europe’s political spasms and other risks. In the final months of the year, investors could bear it no longer. As 2019 begins, the market has to pick itself up from the worst correction since 2011. On Dec. 20, the Nasdaq sank to a bear-market depth. Full Story


